S&P 500: Analyzing and Understanding the Current Trend Pattern of S&P 500 (SPX)

Market Regime Newsletter

A quick glimpse into our market research

Sample Research

Here’s a sample of our Market Regime Newsletter, where we analyze specific markets using our precise approach. This showcases our consistent research and enables users to efficiently apply our indicators and tools to any market.

Key Points:

This Market Regime Newsletter was issued on May 12th, 2024

  • The S&P 500 (SPX) posted its third consecutive winning week, rising by 1.85%.
  • These gains come despite some less favorable macroeconomic news for the US, such as a sharp decline in Michigan’s Consumer Sentiment Index, reaching its lowest level in six months.
  • While facing potential ongoing macroeconomic challenges, our data still suggests a promising outlook, especially when compared to other markets.
  • This outlook is supported by the robust ‘Very High Reward’ market regime for both short-term and long-term perspectives, indicating a strong uptrend backed by high trend quality and increasing smart money positions.

Current Market Regime of the S&P 500 (SPX)

Description of the current Short- and Long-Term Market Regime:

Robust uptrend: Highly positive market regime accompanied by significantly low volatility. Prices consistently show an upward trend, supported by a wide range of well-performing stocks within that market. Even in the face of negative news, the market demonstrates remarkable resilience with such a high positive trend quality. Weak trading days are typically short-lived overbought or sentiment driven reactions, leaving the market better positioned for further gains.

Driving Forces Behind the Current Market Regime:

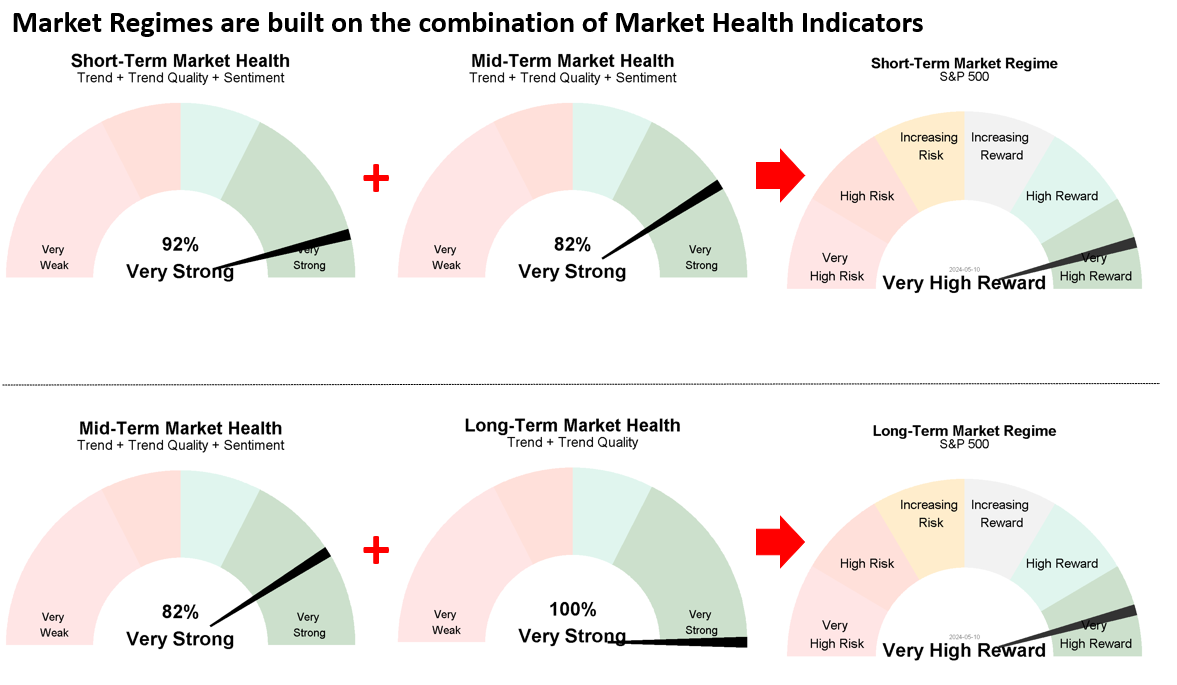
Our research categorizes the market into six predefined market regimes based on trend strength and direction. To analyze these forces, we use dozens of indicator signals covering essential performance factors such as trend, trend quality, sentiment, and the positions of smart and dumb money. These indicators are consolidated into Market Health Indicators, measuring signal positivity across different timeframes for an unbiased trend analysis. Scores on a 0 to 100% scale indicate signal positivity among these indicators. Values below 50% indicate a negative outlook, while those above 50% signal a positive outlook.

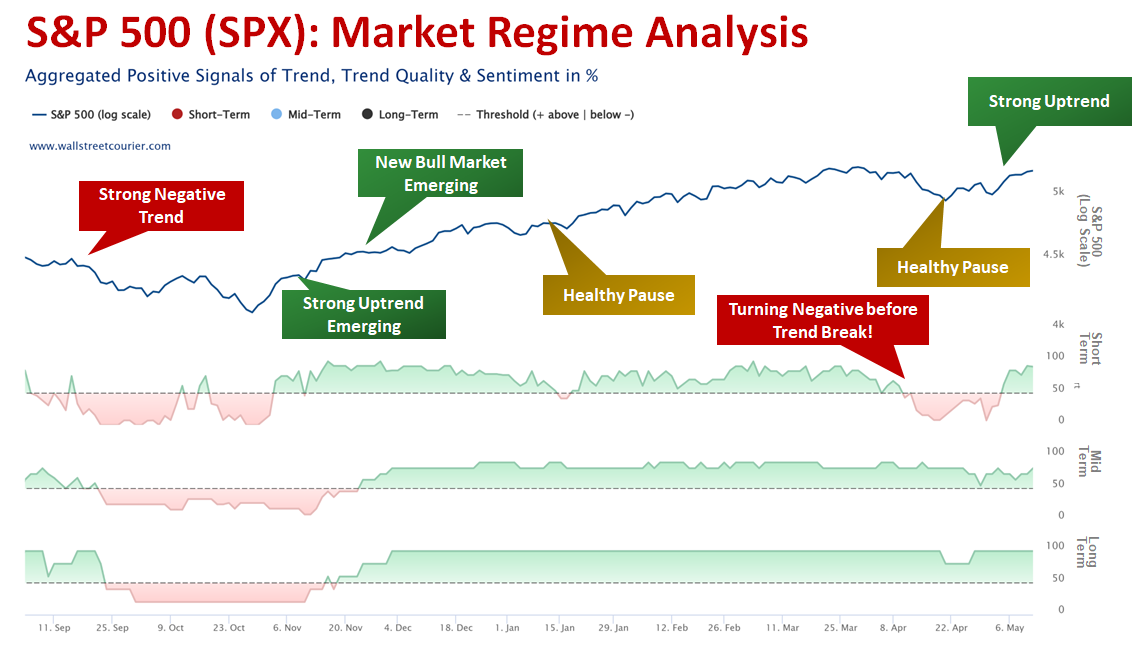
The chart below illustrates the S&P 500 Index (SPX) in the first panel, followed by three subsequent panels detailing Short-, Mid-, and Long-Term Market Health trends over time.

As shown above, the current bull market began in late November 2023. It started with Short-Term Market Health surging towards 100%, accompanied by a significant recovery in Mid- to Long-Term Market Health. These indicators are typical of a strong emerging uptrend following a period of heavy losses. Investors should consider initiating positions while awaiting confirmation from improving Mid- to Long-Term Market Health, which materialized shortly after. It’s worth noting that investor sentiment tends to be fearful during such periods, leading to hesitation about whether to buy the rally or not. Therefore, maintaining discipline and a systematic approach is crucial to capitalize on investment opportunities. Since then, the S&P 500 has rallied over 20%.

In addition to identifying strong up- and downtrends, our Market Health Indicators help differentiate between healthy consolidation periods and corrective phases. This capability is our greatest advantage, as consolidation stages are pivotal moments. They can either facilitate further gains or indicate the beginning of significant downtrends. Consequently, making decisions about capitalizing on profits, leveraging potential dips, exiting the market, or even adopting short positions becomes challenging in such scenarios.

As illustrated in the chart above, this bull run experienced two temporary pauses within the ongoing uptrend. The first was brief, occurring in mid-January of this year, while the second was more significant, with the S&P 500 dropping by almost 7 percent in early to mid-April.

How to spot high-reward & low risk market opportunities

3 Steps for Determining Market Regimes

With our structured approach, we can identify the respective market regime for any market. Our methodology include the following steps:

1

Identify Robust Trends

  • Trends are measured through a systematic screening of signals from multiple indicators (for example the WSC Trend Index, the Smart Money Flow Index or the Daily Put-/Call Ratio All CBOE Options)
  • These indicators cover various categories (trend, trend quality, and sentiment, including dumb- and smart-money positioning) and timeframes.
  • This diversified approach minimizes the impact of noise in individual indicators and enables an unbiased and robust view of current market conditions.
2

Monitor Market Health

  • These indicators are representing composites of these signals for three different timeframes.
  • Scores on a 0 to 100% scale denote signal positivity.
  • Values below 50% indicate a negative outlook, while those above 50% signal positive market health.
  • The combination of these health indicators results in market regimes, indicating the strength of the current trend for a specific timeframe.

3

Determine Market Regimes

  • By combining short- to mid-term and mid-term to long-term market health readings, the specific market regime is determined.
  • These Market Regime gauges help identify market regimes and shifts without the hassle of going through all indicator signals.
  • To be more precise, the Tactical Short-Term Market Regime is constructed upon the combination of short- to mid-term market health, while the Strategic Long-Term Market Regime is based on the amalgamation of mid- to long-term market health.

Healthy consolidation periods are characterized by short-term indicators turning negative while the mid- to long-term condition remains robust. This pattern emerged even before the S&P 500 experienced a significant short-term trend break. It underscores one of the primary advantages of our bottom-up trend analysis, which alerted us to the beginning of the downturn. This was evident as the majority of stocks in the S&P 500 started weakening on a short-term basis, supported by decreasing smart money positioning and negative volume flows. Given the strong Mid- to Long-Term Market Health, the recent decline was merely a temporary pause in an ongoing bull market rather than the start of a major downturn. Indeed, the S&P 500 experienced only a shallow pullback before resuming its upward trajectory. Having this kind of information becomes crucial, especially since financial headlines are saturated with negative news, often causing investors to panic.

Currently, Short- to Long-Term Market Health readings indicate exceptional strength, ranging between 75% and 100%. This underscores the robust nature of the current uptrend in the S&P 500, driven by a majority of stocks in the index, healthy volume flows into the market, and expanding smart money positions. As long as we do not see a significant deterioration below 50% within Short- and Mid-Term Market Health, the outlook for the S&P 500 remains compelling.

From Market Health Indicators To Market Regimes:

These positive market enviornment is also reflected in our Market Regimes gauges below. By combining Short-Term to Mid-Term and Mid-Term to Long-Term Market Health readings, the specific market regime is determined. These Market Regime gauges simplify the identification of market regimes and shifts, eliminating the need to sift through individual indicator signals. Specifically, the Short-Term Market Regime is constructed based on the combination of Short-Term to Mid-Term Market Health, while the Long-Term Market Regime relies on the amalgamation of Mid-Term to Long-Term Market Health.

What the history tells us about the current Market Regimes

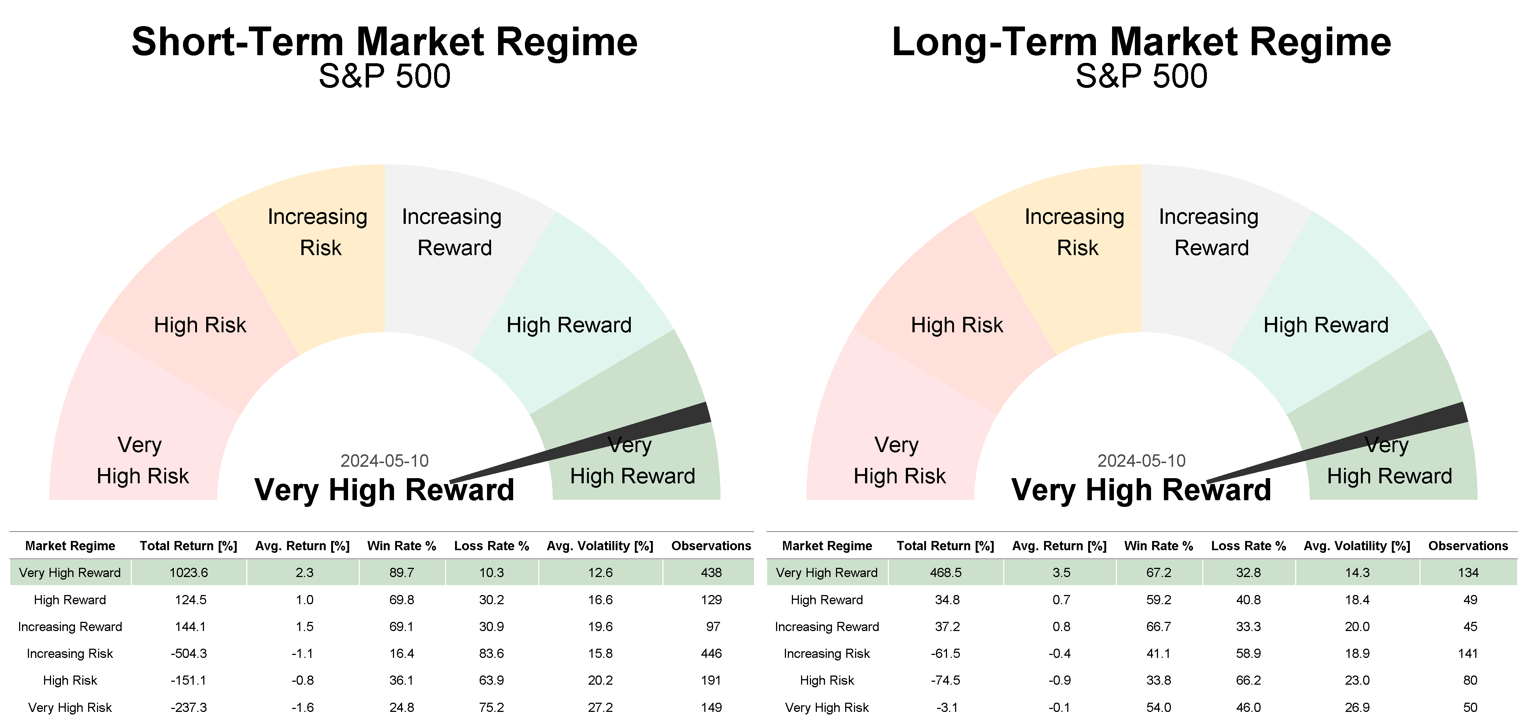
Since the availability of full market regime data dating back to 1985, the S&P 500 Index (SPX) has entered a ‘Very High Reward’ market regime 438 times from a short-term perspective and 134 times from a long-term perspective. These market regimes are characterized by Short- to Long-Term Market Health readings above 50%. Remarkably, in 89.7% of these instances, S&P 500 stocks yielded a total cumulative gain of 1023% when the short-term market regime was positive. The win ratio for the long-term positive market regime was slightly lower at 67.2%, but also had a total gain of 468%. Additionally, the average volatility within these regimes ranged between 12% and 14%, which is quite low.

The Bottom Line

  • With the ‘Very High Reward’ market regime persisting across both timeframes, the outlook for the S&P 500 remains highly compelling.
  • The uptrend is still supported by a broad range of stocks in the index, increasing smart money positions, and cautious sentiment due to negative macroeconomic factors (showing that a lot of negative news is already priced in). These are the main ingredients for a robust uptrend. Therefore, any potential weaknesses ahead are likely just temporary pauses on the way higher — provided that Mid- to Long-Term Market Health Indicators continue to show strength.

Want our Market Regime Trend Analysis sent directly to your mailbox?

Market Regime Newsletter

In our Market Regime Newsletter, we provide analyses of specific markets using our approach to deliver precise outlooks. This showcases our consistent research approach and enables users to efficiently apply our indicators and tools to analyze any market.

Sign up for free to receive our Market Regime Newsletter