VanEck Gold Miners ETF (GDX): Shiny Market Regime Ahead?

Market Regime Newsletter

A quick glimpse into our market research

Sample Research

Here’s a sample of our Market Regime Newsletter, where we analyze specific markets using our precise approach. This showcases our consistent research and enables users to efficiently apply our indicators and tools to any market.

Key Points:

This Market Regime Newsletter was issued on April 21st, 2024

  • Gold has recently seen a significant uptrend, marked by a series of record highs. Since mid-January, the price has surged by 17 percent, reaching a new high of over $2,300 per ounce last week.
  • Despite the positive momentum in the price of gold, many gold mining stocks have not fully reflected this upward trend.
  • The disparity between the soaring price of gold and the lagging performance of gold mining stocks (such as GDX) hints at a potential undervaluation, signaling an impending potential opportunity.
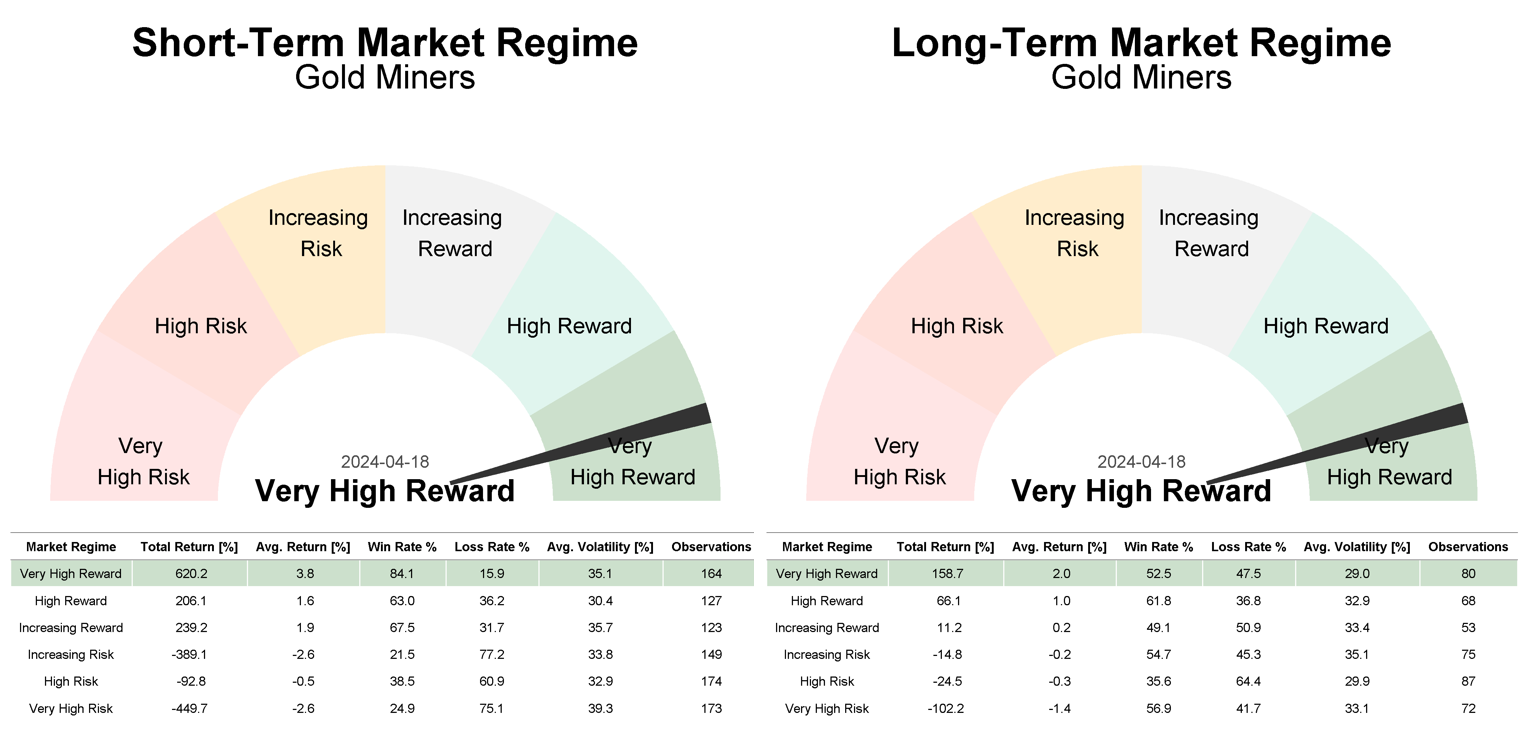
  • This case is supported by our data, which shows that gold mining stocks (GDX) has recently shifted into a ‘Very High Reward’ market regime for both short- and long-term perspectives.

Current Market Regime of the VanEck Gold Miners ETF (GDX):

Description of the current Short- and Long-Term Market Regime:

Robust uptrend. Highly positive market regime accompanied by significantly low volatility. Prices consistently show an upward trend, supported by a wide range of well-performing stocks within that market. Even in the face of negative news, the market demonstrates remarkable resilience with such a high positive trend quality. Weak trading days are typically short-lived overbought, or sentiment driven reactions, leaving the market better positioned for further gains.

Driving Forces Behind the Current Market Regime:

Our definition of market regimes is rooted in a systematic analysis and combination of multiple indicators, aimed to identifying robust trends. These trends are measured by analyzing signals from multiple indicators across various categories (trend, trend quality, and sentiment, including dumb- and smart-money positioning) and timeframes. This diversified approach enables us to maintain an unbiased and robust view of current market conditions by analyzing the most important trend factors.

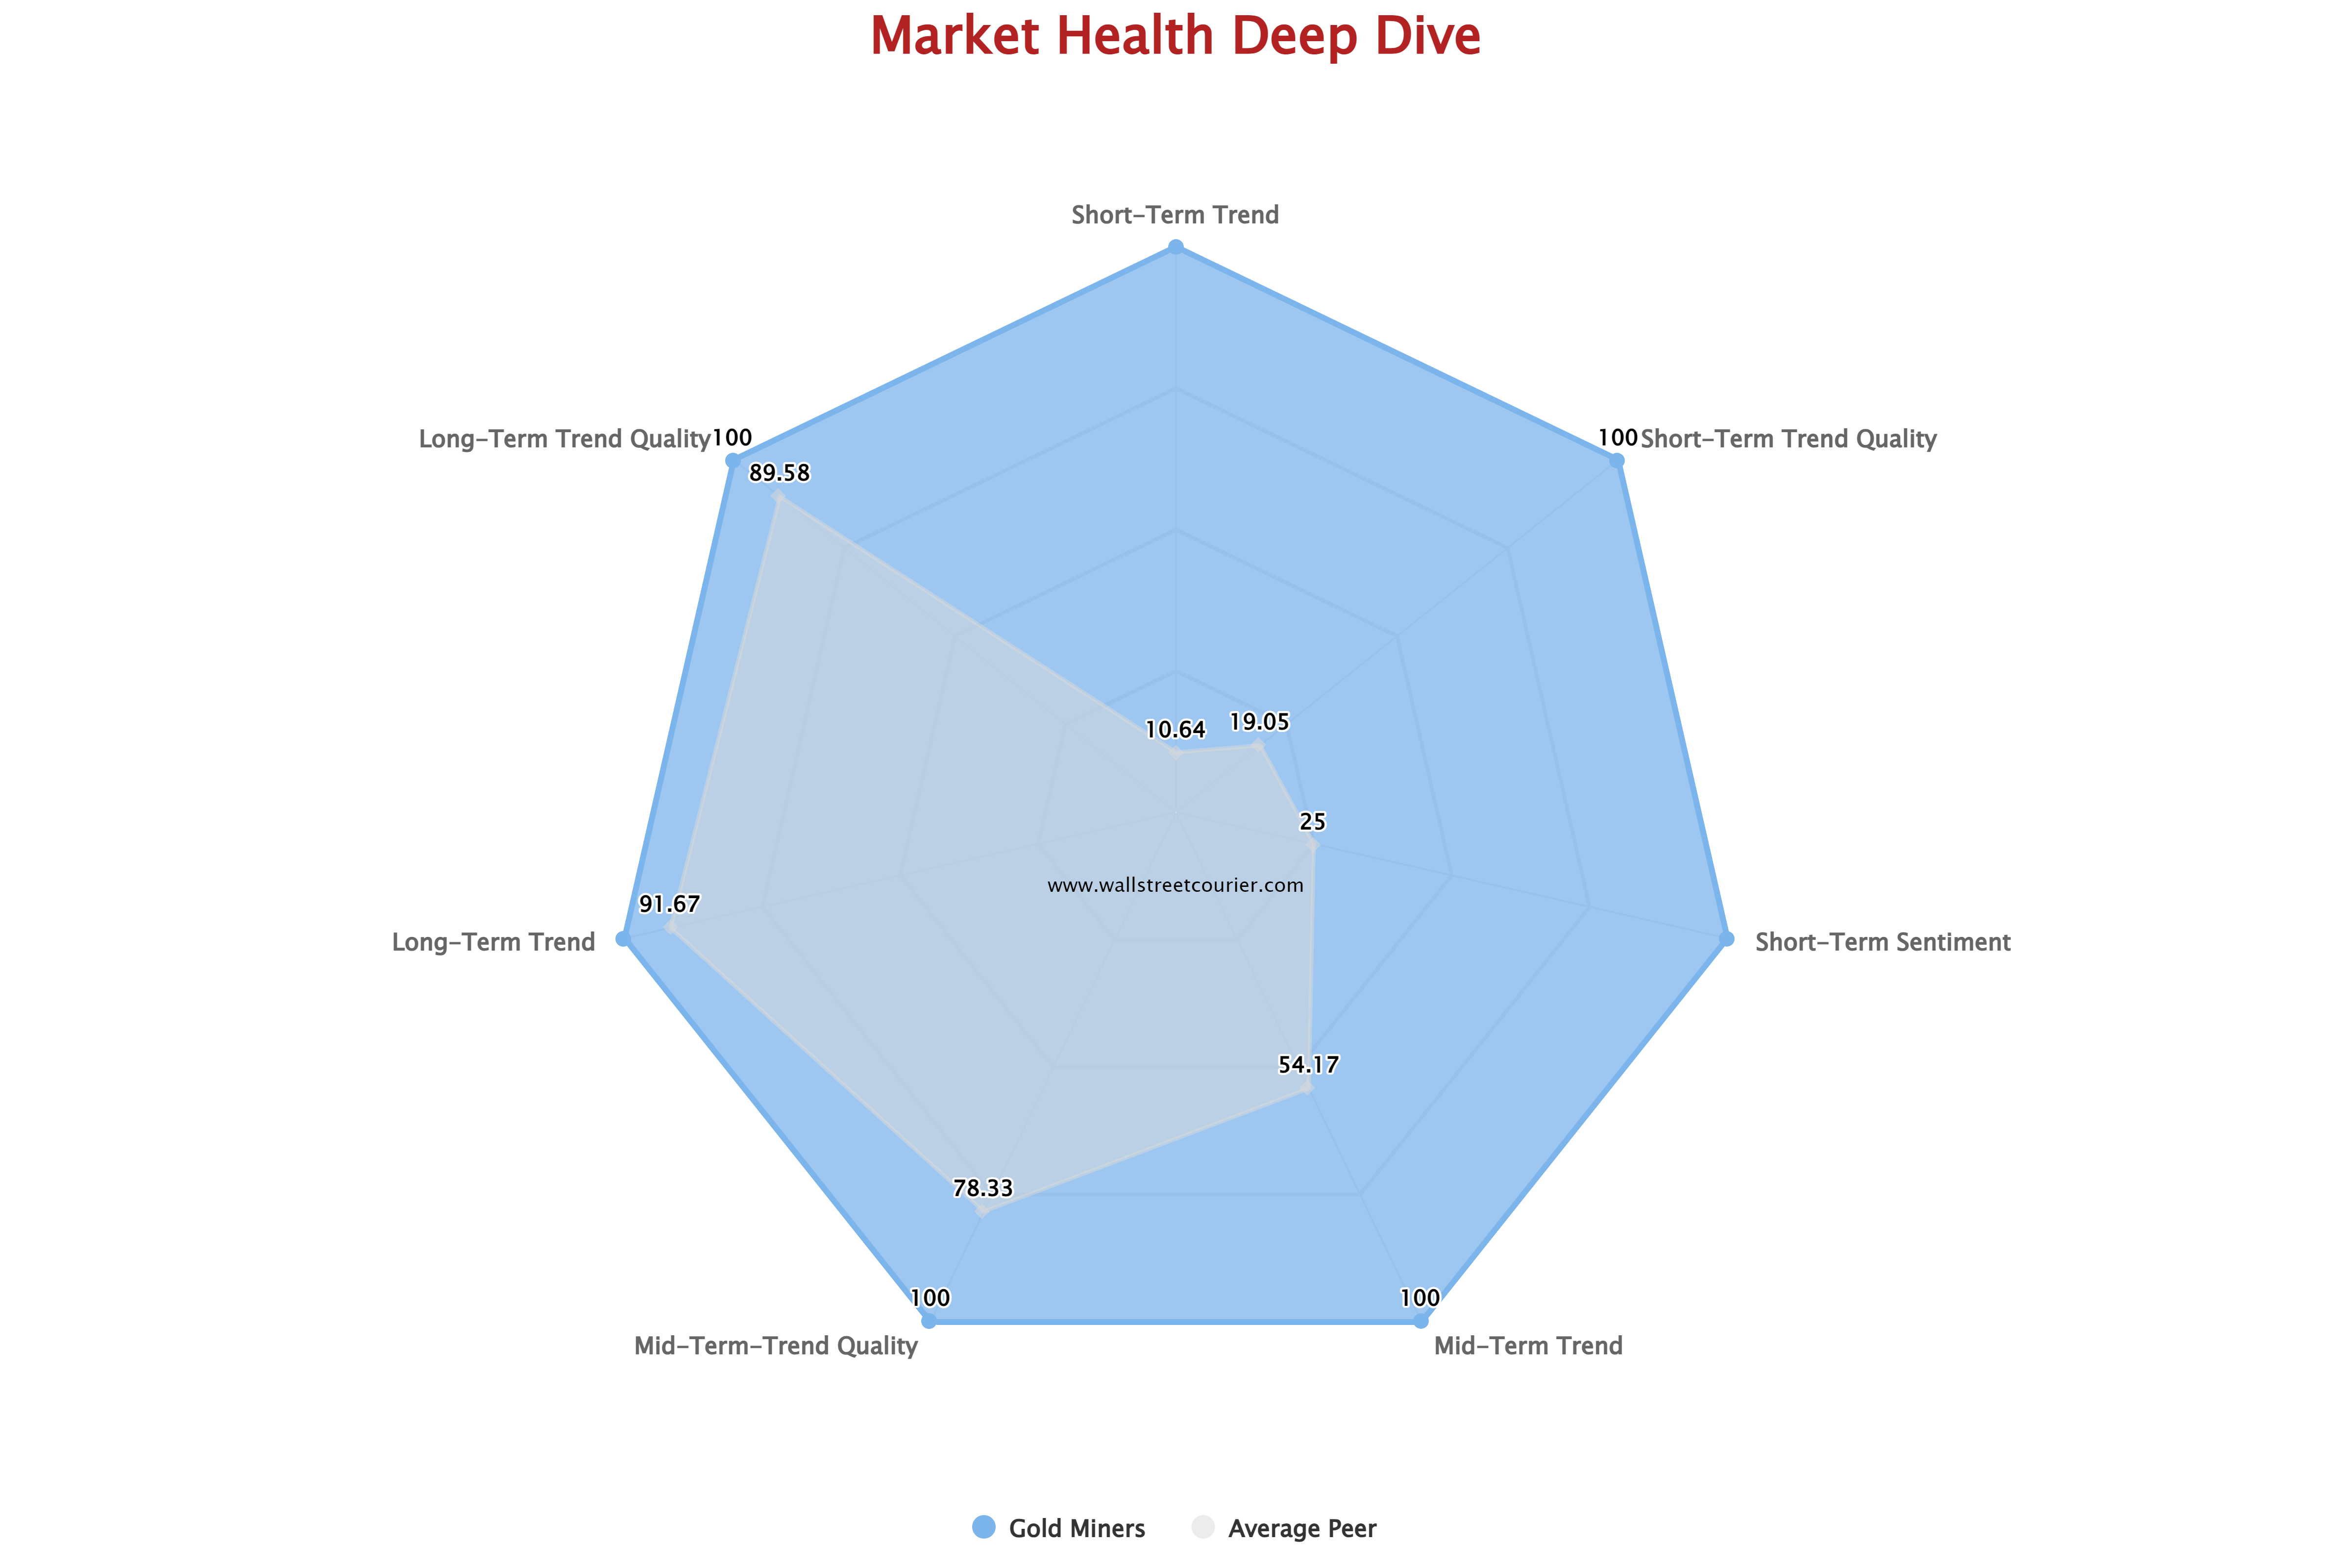
This is also illustrated in the spider chart below, which breaks down the current trend status of the VanEck Gold Miners ETF (GDX) into its key components. The readings range from 0 to 100, with higher values indicating stronger positive signal strength for each component.


As you can see, gold miners (GDX) have robust readings across all timeframes and across all relevant key components. These are typical characteristics of a strong uptrend labeled as the ‘Very High Reward’ market regime, driven by solid momentum, an expanding pool of stocks joining the movement, and increasing smart money positions.

With strong readings across the board, the current uptrend is poised to continue smoothly, with a very low risk of a sudden reversal.

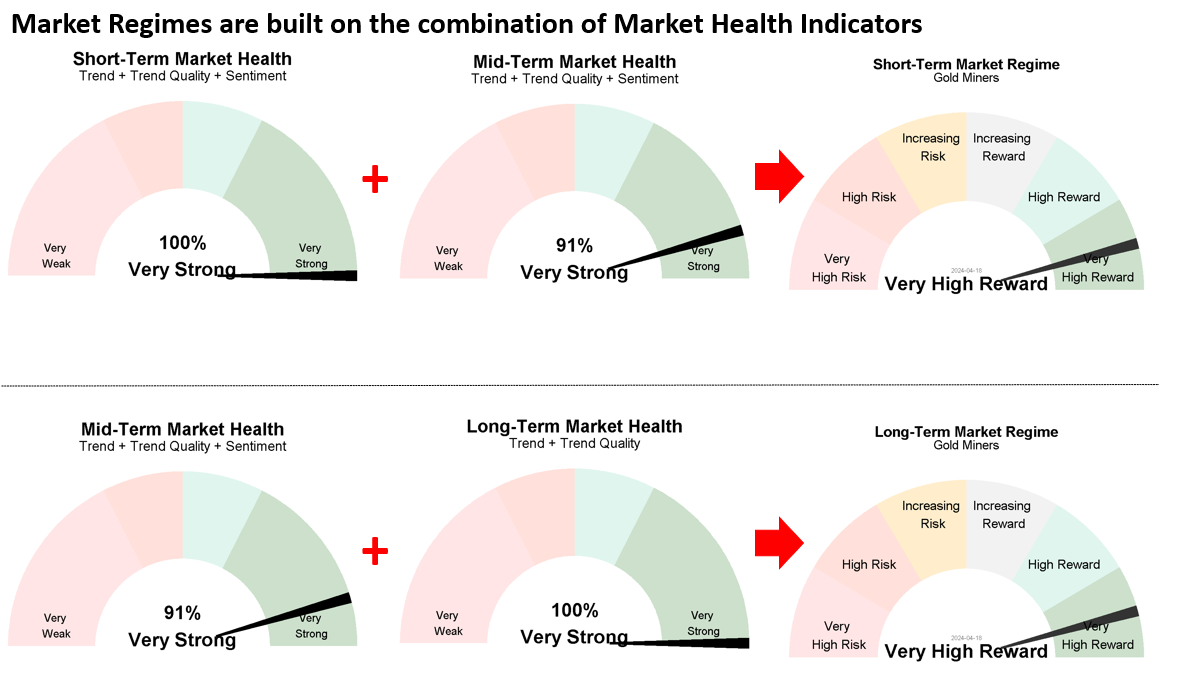
To monitor the trend status of VanEck Gold Miners ETF (GDX) over time, we combine these key components according to their timeframe into Market Health Indicators. These indicators are representing composites of these key componentes for three different timeframes. Scores on a 0 to 100% scale denote signal positivity. Values below 50% indicate a negative outlook, while those above 50% signal positive market health.

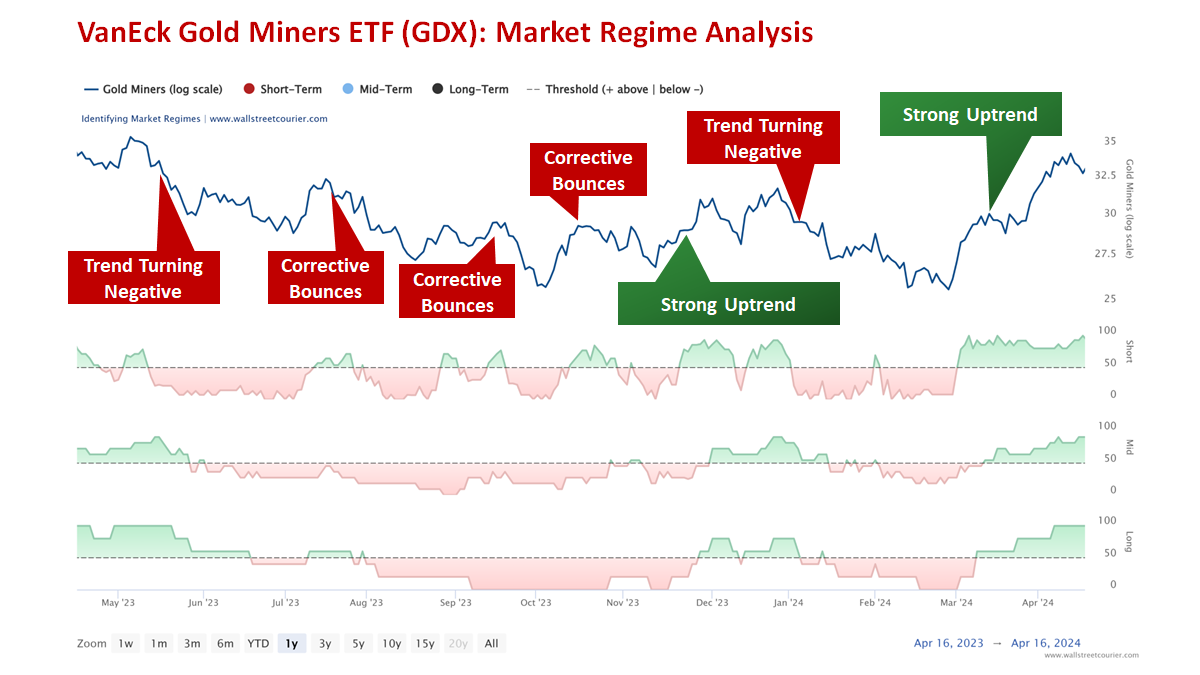
The chart below illustrates the VanEck Gold Miners ETF (GDX) in the first panel, followed by three subsequent panels detailing Short-, Mid-, and Long-Term Market Health over the past year.

Throughout most of the period, gold miners struggled with Short- to Long-Term Market Health readings consistently below 50%, indicating a lack of positive indicators in trend, trend quality, and sentiment. This pattern is characteristic of a pronounced downtrend resulting in a ‘Very High Risk’ market regime. Often, these steep downtrends are punctuated by robust oversold bounces, driven by short-sellers capitalizing on profits, typically spurred by positive news flow. However, since these gains lack substantial backing from real demand, the market swiftly reverts to its initial downtrend once short-sellers resume their positions. These corrective bounces can be easily identified, as in such scenarios, only the ‘Short-Term Market Health’ metric shows signs of recovery, while the Mid- to Long-Term Market Health remains weak.

How to spot high-reward & low risk market opportunities

3 Steps for Determining Market Regimes

With our structured approach, we can identify the respective market regime for any market. Our methodology include the following steps:

1

Identify Robust Trends

  • Trends are measured through a systematic screening of signals from multiple indicators (for example the WSC Trend Index, the Smart Money Flow Index or the Daily Put-/Call Ratio All CBOE Options)
  • These indicators cover various categories (trend, trend quality, and sentiment, including dumb- and smart-money positioning) and timeframes.
  • This diversified approach minimizes the impact of noise in individual indicators and enables an unbiased and robust view of current market conditions.
2

Monitor Market Health

  • These indicators are representing composites of these signals for three different timeframes.
  • Scores on a 0 to 100% scale denote signal positivity.
  • Values below 50% indicate a negative outlook, while those above 50% signal positive market health.
  • The combination of these health indicators results in market regimes, indicating the strength of the current trend for a specific timeframe.

3

Determine Market Regimes

  • By combining short- to mid-term and mid-term to long-term market health readings, the specific market regime is determined.
  • These Market Regime gauges help identify market regimes and shifts without the hassle of going through all indicator signals.
  • To be more precise, the Tactical Short-Term Market Regime is constructed upon the combination of short- to mid-term market health, while the Strategic Long-Term Market Regime is based on the amalgamation of mid- to long-term market health.

Things play out differently when the rally is powered by a widespread demand. In such instances, the initial counter-trend rally evolves into a more substantial uptrend. This has been evident recently as Short to Long-Term Market Health rose to quite confirmative levels. This illustrates that the current uptrend in the VanEck Gold Miners ETF (GDX) is fueled by robust demand, as evidenced by a wide range of stocks in the index trading well above their 20/50/100/150 and 200 moving averages, displaying positive MACD readings, strong uptick in volumes, an increasing number of new highs, and further positive signals among dozens of other indicators. Consequently, the risk of a sudden trend reversal should remain exceedingly low as long as we observe such strong values across the board.

From Market Health Indicators To Market Regimes:

This positive market environment is reflected in our Market Regimes Gauges below. By combining short- to mid-term and mid-term to long-term market health readings, the specific market regime is determined. These Market Regime gauges help identify market regimes within seconds. To be more precise, the Tactical Short-Term Market Regime is constructed upon the combination of short- to mid-term market health, while the Strategic Long-Term Market Regime is based on the amalgamation of mid- to long-term market health.

What the history tells us about the current Market Regimes

Since full market regime data became available in 2006, the VanEck Gold Miners ETF (GDX) has entered a ‘Very High Reward’ market regime 164 times from a short-term perspective and 80 times from a longer one. These regimes are marked by Short- to Long-Term Market Health readings consistently above 50%. Impressively, in 84.1% of these instances, GDX yielded positive returns. However, the picture changes slightly for the longer term. Here, GDX has a win rate of only 52%, indicating high volatility and making it primarily suitable for tactical traders. This fact becomes apparent when analyzing volatility within these regimes, which averages around 29% in the long term and 35% in the short term.

The Bottom Line

  • With persistently positive Short- to Long-Term Market Health Indicators, the latest uptrend in gold miners looks quite promising. This view aligns with the current market regime combination, which typically occurs during robust and sustained uptrends.
  • With the ‘Very High Reward’ market regime persisting across both timeframes, the outlook for the VanEck Gold Miners ETF (GDX) remains highly compelling as long as Short- to Long-Term Market Health maintains its strong readings.

Want our Market Regime Trend Analysis sent directly to your mailbox?

Market Regime Newsletter

In our Market Regime Newsletter, we provide analyses of specific markets using our approach to deliver precise outlooks. This showcases our consistent research approach and enables users to efficiently apply our indicators and tools to analyze any market.

Sign up for free to receive our Market Regime Newsletter