Understanding the S&P 500's Record Highs: Analyzing Market Health and Risks Amid Narrow Leadership

Market Regime Newsletter

A quick glimpse into our market research

Sample Research

Here’s a sample of our Market Regime Newsletter, where we analyze specific markets using our precise approach. This showcases our consistent research and enables users to efficiently apply our indicators and tools to any market.

Key Points:

This Market Regime Newsletter was issued on June 16th, 2024

  • The S&P 500 (SPX) closed at record highs for four consecutive sessions last week, culminating in a 14.5% year-to-date gain.
  • Despite these new all-time highs, our analysis indicates a concerning trend of increasingly narrow market leadership.
  • Recent gains have been predominantly driven by a small number of heavyweight stocks within the S&P 500, rather than a broad-based market advance.
  • As a result, the market is becoming increasingly vulnerable to negative surprises.
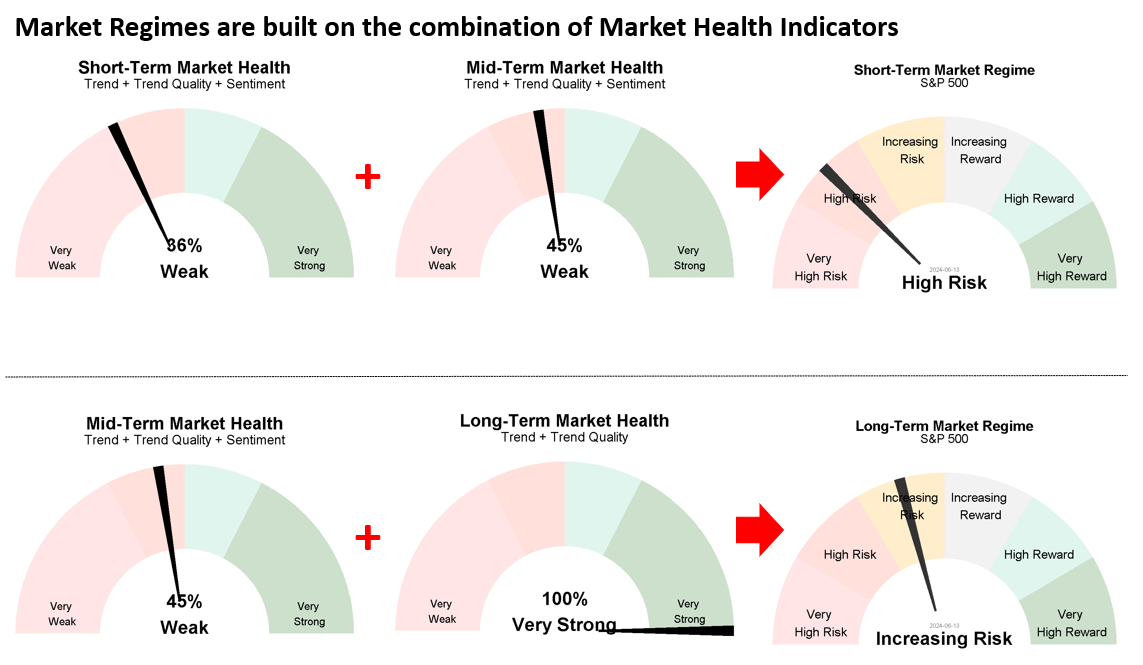
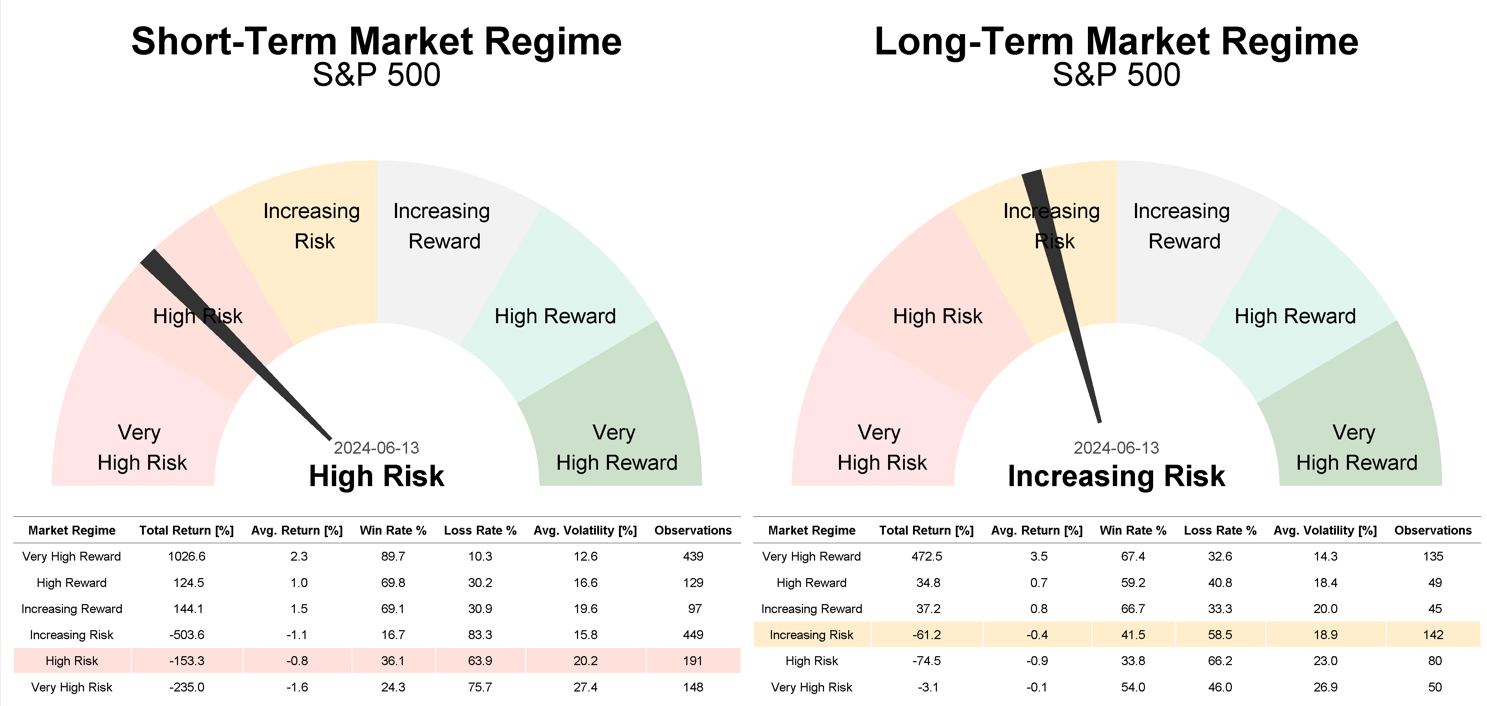
  • This elevated risk is now also reflected in our market regime gauges, which classify the market environment as “High Risk” in the short term and “Increasing Risk” in the longer term.

Current Market Regime of the S&P 500

Description of the current Short- and Long-Term Market Regime:

Short-Term:
High Risk Market Regime:

Resilient downtrend of most stocks in the index resulting in a negative market regime, characterized by high and increasing volatility. Prices generally exhibit a negatively biased trend, accompanied by a wide range of stocks within the market already performing poorly. The market reacts strongly to negative news, increasing the likelihood of triggering more substantial and prolonged losses. Even if the market is not facing stronger losses immediately, given the fact that the trend is deteriorating across all time frames, the upside potential also looks extremely capped in that regime. It’s worth noting that stronger and longer-lasting corrections historically mostly began within that regime, although not every ‘High Risk Market Regime’ led to a correction/bear market.

Long-Term:
Increasing Risk Market Regime:

Consolidation: Increasingly negative market regime, accompanied by low but steady increasing volatility. The market is taking a breather after a period of stronger gains, as sentiment typically reaches extremely positive levels. Thus, nobody is left to push prices higher. In a shorter-term perspective, the trend turns negative, which is supported by a wide range of negatively performing stocks within that market. Given the fact that the trend and the trend quality on a longer time perspective are still supportive, there is a chance that the market is getting back on track when sentiment turns fearful.

Driving Forces Behind the Current Market Regime:

Our approach to defining market regimes is grounded in a comprehensive analysis that integrates a variety of indicators. The objective is to identify underlying trends within major market indices and sectors. By systematically evaluating signals from a range of categories – including trend, trend quality, and sentiment (which encompasses both dumb-money and smart-money positioning) – across different timeframes, we can classify trends by their direction and strength into six distinct market regimes. Each regime has a unique risk-reward profile, providing an impartial and thorough perspective on current market conditions.

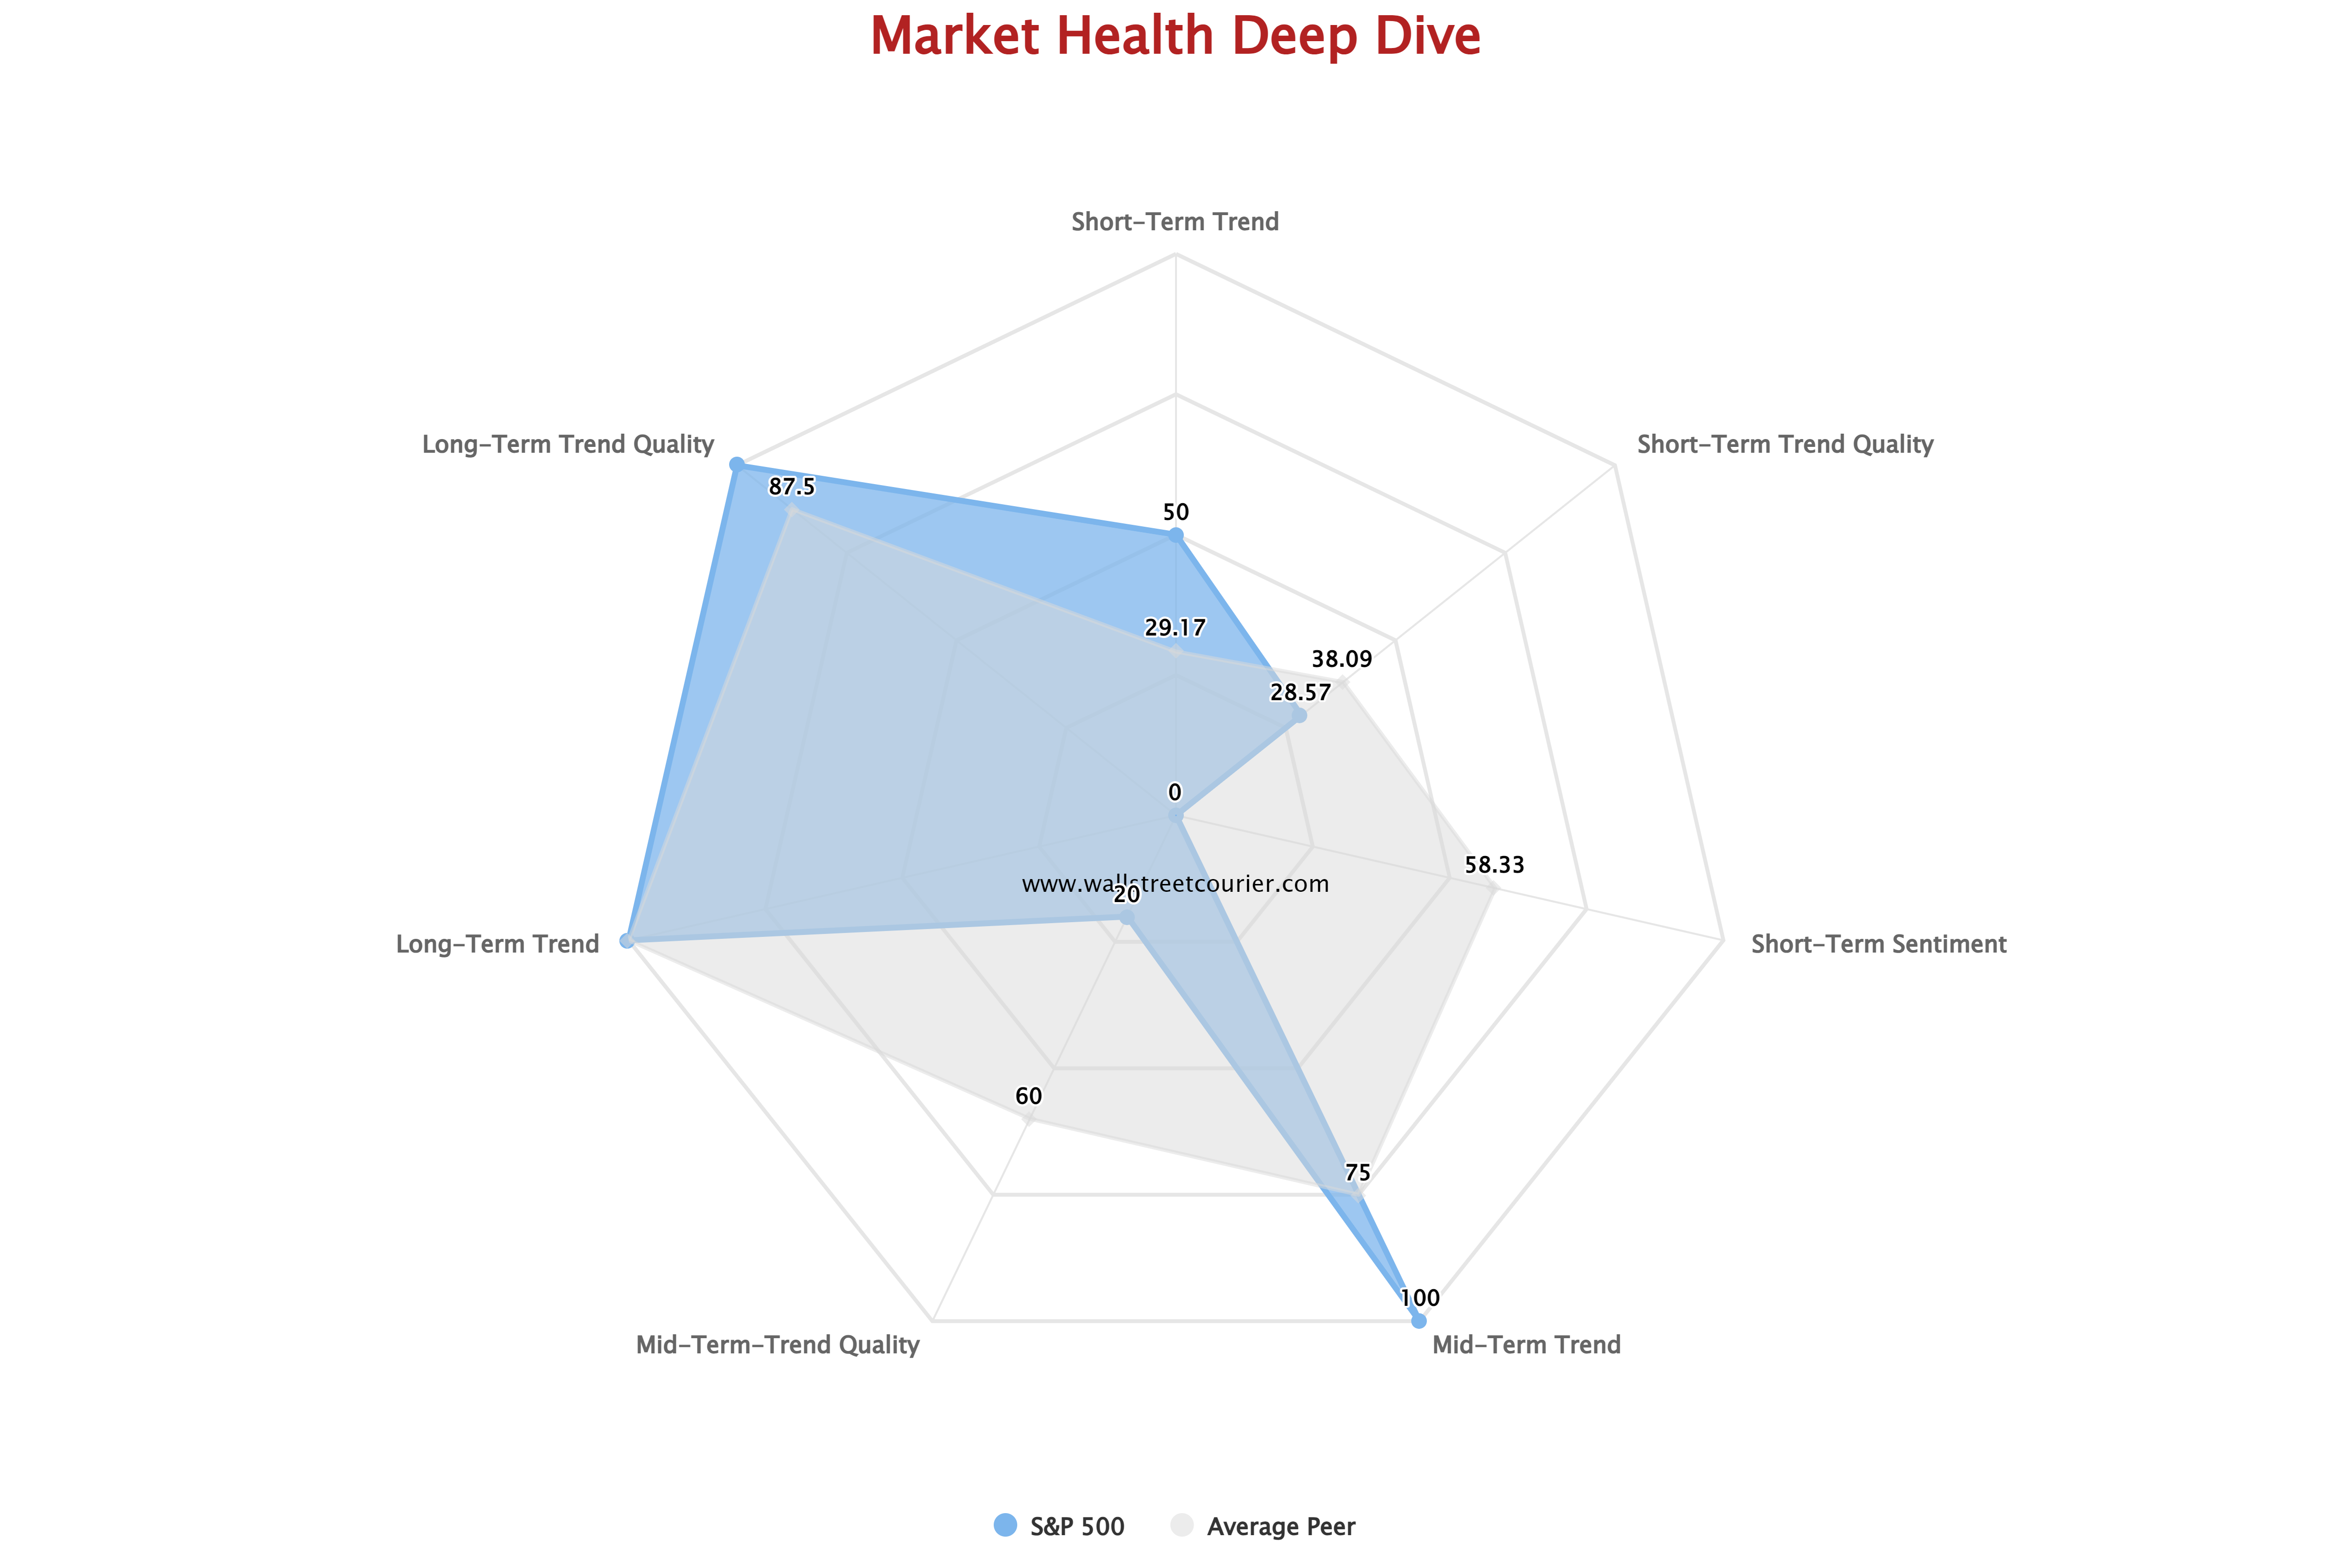
Further insights are illustrated in the spider chart below, which shows the current strength of each component (trend, trend quality, and sentiment) measured by positive indicator signals in percent. The short-term technical condition of the S&P 500 appears notably weak, with positive readings well below 50 percent across various indicators. Similarly, on a mid-term basis, the situation remains concerning. Although the trend indicators for the S&P 500 itself are neutral, with a 50% positivity score, indicators for its constituents show significant weakness.

Overall, these patterns suggest that the majority of stocks within the index are already in decline, forming a strong short-term downtrend. Moreover, this downtrend is gaining momentum and strength on a mid-term basis. Interestingly, despite the S&P 500 trading near record highs, this is primarily driven by a few mega-cap stocks rather than broad-based market participation. Consequently, the latest record high lacks a solid foundation, as it is not supported by widespread market strength. This makes the current uptrend extremely vulnerable, as a reversal in a few heavily weighted stocks could exert significant downward pressure.

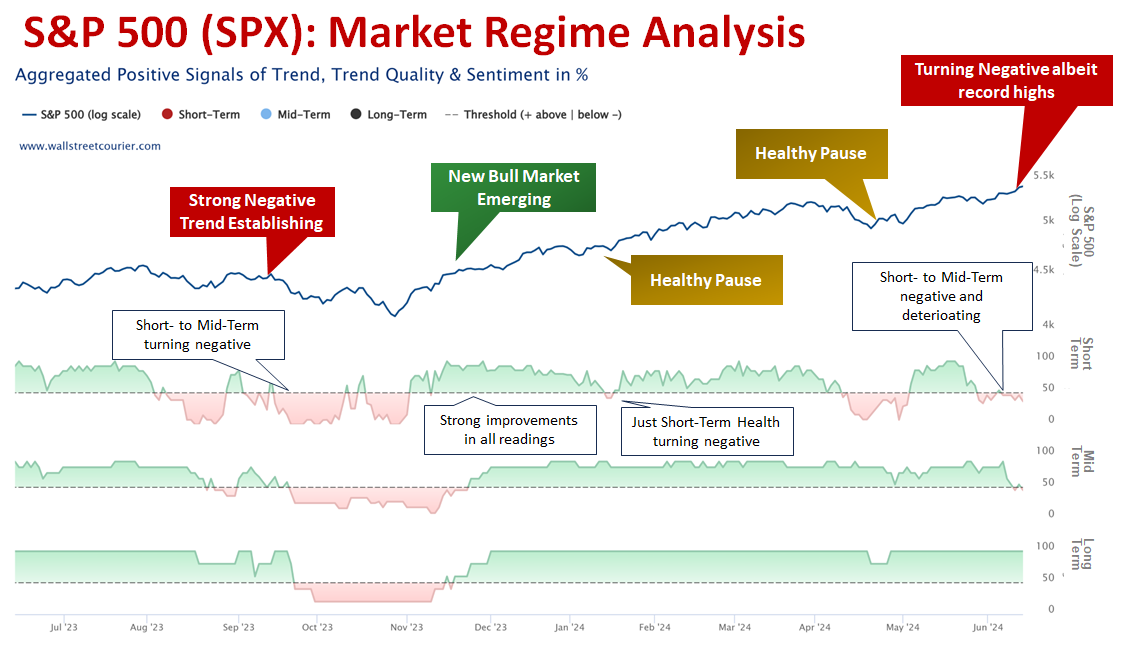
To track these performance factors over time, these signals are aggregated into Market Health Indicators, as shown in the chart below. These indicators represent composite scores across three distinct timeframes. Scores on a scale from 0 to 100% indicate signal positivity, with values below 50% suggesting a negative outlook and values above 50% indicating positive market health. These health indicators collectively determine market regimes, providing insights into the strength of the current trend within each timeframe.

The chart below features the S&P 500 (SPX) in the first panel, followed by subsequent panels illustrating Short-, Mid-, and Long-Term Market Health developments over time.

Currently, the S&P 500 is trading near record highs. While this initially suggests robust market conditions, most short-term indicators – covering trend, trend quality (including market breadth), and sentiment – have already turned negative. Similarly, from a mid-term perspective, less than 50% of indicators show positive signals. This divergence indicates that a significant portion of S&P 500 stocks are already in a pronounced downtrend, highlighting that the recent record high is primarily driven by a few mega-cap stocks.

How to spot high-reward & low risk market opportunities

3 Steps for Determining Market Regimes

With our structured approach, we can identify the respective market regime for any market. Our methodology include the following steps:

1

Identify Robust Trends

  • Trends are measured through a systematic screening of signals from multiple indicators (for example the WSC Trend Index, the Smart Money Flow Index or the Daily Put-/Call Ratio All CBOE Options)
  • These indicators cover various categories (trend, trend quality, and sentiment, including dumb- and smart-money positioning) and timeframes.
  • This diversified approach minimizes the impact of noise in individual indicators and enables an unbiased and robust view of current market conditions.
2

Monitor Market Health

  • These indicators are representing composites of these signals for three different timeframes.
  • Scores on a 0 to 100% scale denote signal positivity.
  • Values below 50% indicate a negative outlook, while those above 50% signal positive market health.
  • The combination of these health indicators results in market regimes, indicating the strength of the current trend for a specific timeframe.

3

Determine Market Regimes

  • By combining short- to mid-term and mid-term to long-term market health readings, the specific market regime is determined.
  • These Market Regime gauges help identify market regimes and shifts without the hassle of going through all indicator signals.
  • To be more precise, the Tactical Short-Term Market Regime is constructed upon the combination of short- to mid-term market health, while the Strategic Long-Term Market Regime is based on the amalgamation of mid- to long-term market health.

Consequently, this latest high lacks a solid foundation, as it does not reflect broad-based market strength. This puts the S&P 500 at high risk of significant declines from current levels, as a reversal in a few heavily weighted stocks cannot be offset by a robust safety net.

While not every instance of narrow leadership has led to a correction, every correction has begun with such conditions. A comparable scenario occurred for the S&P 500 in September 2023. During that period, Short-Term Market Health turned negative, followed by similar negative readings in Mid- to Long-Term Market Health. Despite a brief attempt at a rally, which lacked confirmation from Market Health indicators, the S&P 500 subsequently experienced a more pronounced correction lasting until late October.

Therefore, even if a further rally in large-cap stocks ensues, the risk of substantial declines remains elevated as long as Short- to Mid-Term Market Health indicators show limited signs of recovery. Even in the absence of immediate declines, the risk of significant underperformance compared to other global market indices remains a concern.

From Market Health Indicators To Market Regimes:

This negative market environment is reflected in our Market Regimes Gauges below. By combining signals from short- to mid-term and long-term indicators into Market Health readings, we determine the specific market regime. These Market Regime gauges help identify market regimes and shifts without the hassle of going through all indicator signals. To be more precise, the Tactical Short-Term Market Regime is constructed upon the combination of Short- to Mid-term Market Health, while the Strategic Long-Term Market Regime is based on the amalgamation of Mid- to Long-term Market Health.

What the history tells us about the current Market Regimes

Since full market regime data became available in 1986, the S&P 500 has entered a ‘ High Risk’ market regime 193 times from a short-term perspective and an ‘Increasing Risk’ market regime 143 times from a long-term perspective. In the short-term ‘High Risk’ regime, S&P 500 declined in 63.7% of instances. From a long-term perspective, the S&P 500 also demonstrate weakness as the index yielded just an average return of -0.4% in that time period.

The Bottom Line

  • The recent record highs of the S&P 500 (SPX) mask some underlying weaknesses, notably the narrow leadership observed in our declining Short- to Mid-Term Market Health indicators.
  • This makes the current uptrend extremely vulnerable, as a reversal in these few heavily weighted stocks could easily trigger significant selling pressure as there is no safety net around to cushion such a move.
  • While narrow leadership has not always resulted in a pullback, all pullbacks historically start under such conditions. Historical data shows that the S&P 500 has typically faced challenges in similar market situations.
  • Therefore, even if we see further record highs ahead, it might be a good time to reconsider current risk positions as long as these negative divergences exist.

Want our Market Regime Trend Analysis sent directly to your mailbox?

Market Regime Newsletter

In our Market Regime Newsletter, we provide analyses of specific markets using our approach to deliver precise outlooks. This showcases our consistent research approach and enables users to efficiently apply our indicators and tools to analyze any market.

Sign up for free to receive our Market Regime Newsletter