China’s Stock Market (CSI 300): What Does Sovereign Wealth Fund Intervention Mean for Investors?

Market Regime Newsletter

A quick glimpse into our market research

Sample Research

Here’s a sample of our Market Regime Newsletter, where we analyze specific markets using our precise approach. This showcases our consistent research and enables users to efficiently apply our indicators and tools to any market.

Key Points:

This Market Regime Newsletter was issued on September 1st, 2024

  • China’s stock market (CSI 300) ended the week on a high note, driven by significant purchases from a domestic sovereign wealth fund.
  • Despite these gains, the CSI, which tracks the largest Chinese stocks, has plummeted 42% since reaching its peak in 2021.
  • The recent purchases by the sovereign wealth fund serve as a strong fundamental catalyst and align with the growing interest in Chinese stocks among value investors. 2. However, our data still does not provide convincing evidence of a sustainable turning point for Chinese equities.
  • Although we anticipate no more than a temporary oversold bounce, opportunistic traders may seize the moment as long as our Smart Money Indicator continues to drive prices higher.

Current Market Regime of the CSI 300

Description of the Current 'Very High Risk Market Regime'

Currently, Chinese stocks are in a “very High Risk Market Regime”. This market regime represents a highly negative environment accompanied by significantly high volatility. Prices are generally decreasing, and this downward trend is supported by a broad range of underperforming stocks within that market. As a result, the market strongly reacts in a negative manner to any negative news. Positive trading days experienced are typically short-lived oversold reactions and, therefore, not sustainable in price and time.

Since the availability of full market regime data dating back to 2005, the Chinese stocks (CSI 300) had entered a ‘Very High-Risk Market Regime’ 150 times on a short-term basis and 63 times on a long-term basis. Impressively, in 73.3% of these instances, Chinese stocks finished lower on a short-term time perspective (short-term market regime), and 56.7% lower on a long-term time perspective (long-term market regime).

Our definition of market regimes is rooted in a thorough analysis of multiple indicators with high predictive power. These indicators comprehensively cover the most essential performance factors, including trend, trend quality, sentiment, as well as the positions of both smart and dumb money. Market regimes are determined by the percentage of positive signals among these indicators, considering their respective timeframes. In total, we have six predefined regimes ranging from ‘Very High Reward’ to ‘Very High Risk,’ each with its own distinct risk-reward characteristics. This framework enables investors to swiftly adapt their portfolio to new circumstances.

Driving Forces Behind the Current Market Regime:

As illustrated in the flow chart below, the Chinese stocks (CSI 300) shows minimal positive signals across critical metrics like trend, trend quality, and sentiment (including smart- and dumb money positioning). A few positive signals, particularly affecting sentiment and smart money positions, do exist. However, overall, the current market condition of Chinese stocks (CIS 300) appears quite grim.

The flow chart is a very useful tool to analyze indicator signals based on their category and timeframe to identify the current trend strength and trend direction (for an interactive deep dive into the chart, please visit our website).

Analyzing the Market Environment of the CSI 300 Over Time

Aggregating these signals according to their underlying timeframe enables us to monitor the market’s health over time. To be more precise, our Market Health Indicators are composites of trend, trend quality (also known as breadth), and sentiment signals (including Smart- and Dumb Money signals) for specific timeframes. Scores on a 0 to 100% scale denote signal positivity, with values above 50% indicating a positive outlook and values below 50% indicating a negative one.

The chart below illustrates Chinese stocks (CSI 300) in the first panel, followed by three subsequent panels detailing short-, mid-, and long-term Market Health trends over time.

With our Short- to Long-Term Market Health Indicators mostly reading below 50%, the market environment for Chinese stocks was predominantly negative during the period shown. While it might be tempting to bottom-fish in Chinese stocks given the strong support from the sovereign wealth fund, there is currently no compelling reason to do so. Persistently negative Market Health Indicators suggest that Chinese stocks could still face significant declines from current levels. 

Although the strong downtrend might be temporarily interrupted by limited oversold bounces — potentially pushing Short-Term Market Health into positive territory — the risk of further waterfall-like declines remains high as long as Mid- to Long-Term Market Health shows limited signs of recovery. Even without substantial declines in the near future, the risk of significant underperformance against other global market indices remains notably high.

In the very short term, there is a strong likelihood that the recent buying spree from the sovereign wealth fund is not yet complete. As a result, the current market bounce could continue until the fund has fully allocated its capital.

Above, you can see the WSC Capitulation Index, which tracks significant institutional buying and selling activity. This indicator, derived from the well-regarded WSC Smart Money Flow Index for the CSI 300, is one of the most popular on our portal due to its proven accuracy. As indicated, the index remains positive, signaling that the Smart Money buying spree is ongoing — an opportunity that opportunistic traders may well exploit. However, given the prevailing negative market conditions, it is crucial to exercise tight risk management.

How to spot high-reward & low risk market opportunities

3 Steps for Determining Market Regimes

With our structured approach, we can identify the respective market regime for any market. Our methodology include the following steps:

1

Identify Robust Trends

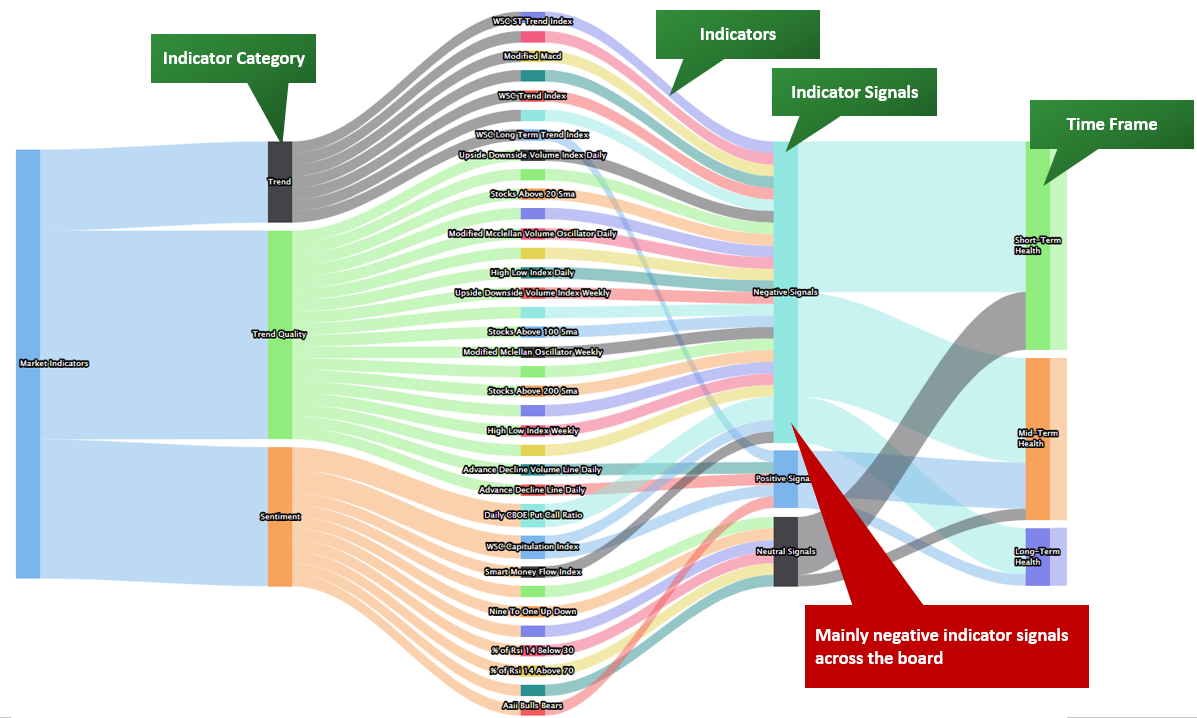
  • Trends are measured through a systematic screening of signals from multiple indicators (for example the WSC Trend Index, the Smart Money Flow Index or the Daily Put-/Call Ratio All CBOE Options)
  • These indicators cover various categories (trend, trend quality, and sentiment, including dumb- and smart-money positioning) and timeframes.
  • This diversified approach minimizes the impact of noise in individual indicators and enables an unbiased and robust view of current market conditions.

2

Monitor Market Health

  • These indicators are representing composites of these signals for three different timeframes.
  • Scores on a 0 to 100% scale denote signal positivity.
  • Values below 50% indicate a negative outlook, while those above 50% signal positive market health.
  • The combination of these health indicators results in market regimes, indicating the strength of the current trend for a specific timeframe.

3

Determine Market Regimes

  • By combining short- to mid-term and mid-term to long-term market health readings, the specific market regime is determined.
  • These Market Regime gauges help identify market regimes and shifts without the hassle of going through all indicator signals.
  • To be more precise, the Tactical Short-Term Market Regime is constructed upon the combination of short- to mid-term market health, while the Strategic Long-Term Market Regime is based on the amalgamation of mid- to long-term market health.

From Market Health Indicators To Market Regimes

This negative market environment is reflected in our Market Regimes Gauges below. By combining short- to mid-term and mid-term to long-term market health readings, the specific market regime is determined. These Market Regime gauges help identify market regimes and shifts without the hassle of going through all indicator signals. To be more precise, the Tactical Short-Term Market Regime is constructed upon the combination of short- to mid-term market health, while the Strategic Long-Term Market Regime is based on the amalgamation of mid- to long-term market health.

The Bottom Line

  • Most indicators remain negative on Chinese stocks, suggesting that the recent intervention by the sovereign wealth fund may be little more than a temporary boost.

  • Even if the index avoids further significant declines, upside potential is likely to remain constrained by weak readings across the board. Therefore, it may be prudent to delay any bottom-fishing activities, despite the current attractiveness of valuations.

  • As such, the outlook for Chinese stocks (CSI 300) remains unfavorable unless a meaningful recovery in our Market Health Indicators signals a positive regime shift.

Want our Market Regime Trend Analysis sent directly to your mailbox?

Market Regime Newsletter

In our Market Regime Newsletter, we provide analyses of specific markets using our approach to deliver precise outlooks. This showcases our consistent research approach and enables users to efficiently apply our indicators and tools to analyze any market.

Subscribe to our Market Regime Newsletter