Bullish Brilliance: Positive Outlook on the MSCI World Still Persists

Market Regime Newsletter

A quick glimpse into our market research

Sample Research

Here’s a sample of our Market Regime Newsletter, where we analyze specific markets using our precise approach. This showcases our consistent research and enables users to efficiently apply our indicators and tools to any market.

Key Points:

This Market Regime Newsletter was issued on February 18th, 2024

  • The MSCI World has surged by a substantial 6% since we emphasized the ‘Very High Reward’ market regime in our mid-December research newsletter.
  • This positive market regime continues to be supported by robust signals from 1500 indicators across 26 major indexes and sectors.
  • Consequently, our data reinforces the expectation for a sustained continuation of the global bull run.
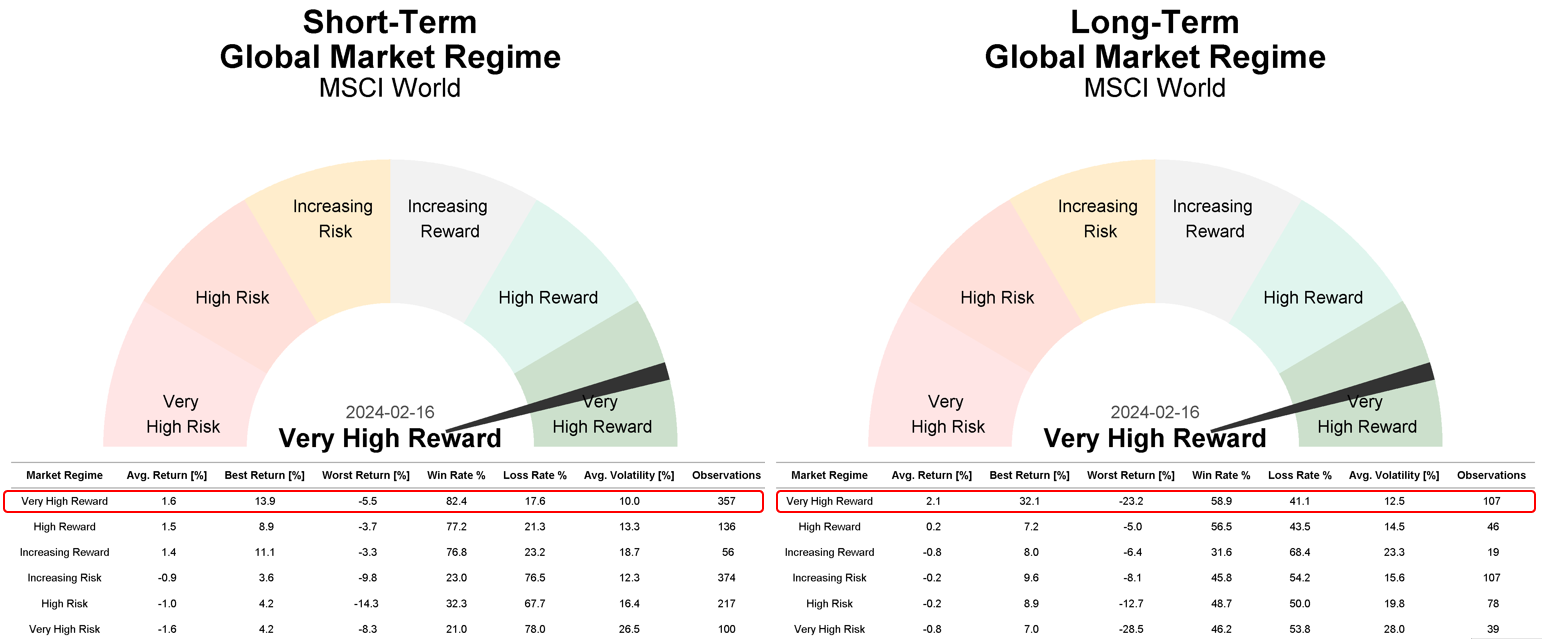
  • Historically, the MSCI World demonstrated gains in 82.4% of all cases when operating within a ‘Very High Reward’ market regime.

Current Market Regime of the Nikkei 225

Description of the Current “Very High Reward” Market Regime:

Highly positive market regime accompanied by significantly low volatility. Prices consistently show an upward trend, supported by a wide range of well-performing stocks within that market. Even in the face of negative news, the market demonstrates remarkable resilience with such a high positive trend quality. Weak trading days are typically short-lived overbought or sentiment driven reactions, leaving the market better positioned for further gains.

Driving Forces Behind the Current Market Regime:

We determine Market Regimes for the MSCI World through a systematic screening of signals from multiple indicators across various categories, including trend, trend quality, sentiment, and the positions of smart and dumb money. We assess these signals over different timeframes for 26 global market indices and sectors.

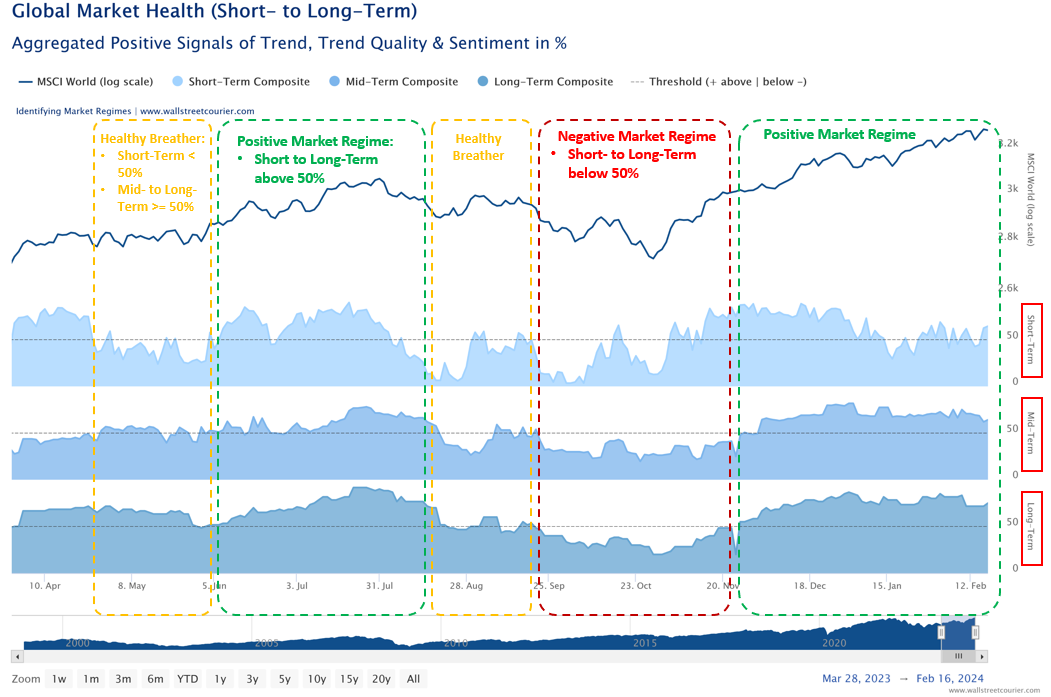
These signals are then consolidated into Market Health Indicators (refer to the chart below), representing composites of these signals, which cover more than 1500 indicators across three different timeframes. This diversified approach minimizes the impact of noise in individual indicators, enabling an unbiased and robust perspective. Scores on a 0 to 100% scale indicate signal positivity. Values below 50% suggest a negative outlook, while those above 50% indicate positive market health.

Except for a brief period between September and November last year, the market environment for the MSCI World remained predominantly positive. In the early months, spanning from April to late May, the Short-Term Market Health briefly turned negative, while mid- to long-term readings stayed strong – a typical pattern following substantial gains. Similar patterns emerged in early August to mid-September.

However, by late September, the situation shifted markedly. All Market Health Indicators, especially Mid- to Long-Term, experienced a downturn, signaling a transition from a positive to a negative market regime across the majority of global markets. Unsurprisingly, the MSCI World underwent a noticeable correction until late October, after which market regimes for global markets and sectors started to show signs of improvement.

Currently, all Market Health Indicators are robust, confirming the ongoing rally. This marks a favorable phase for the MSCI World, where the positive global trend is propelled by advantageous market regimes across most underlying market indices and sectors.

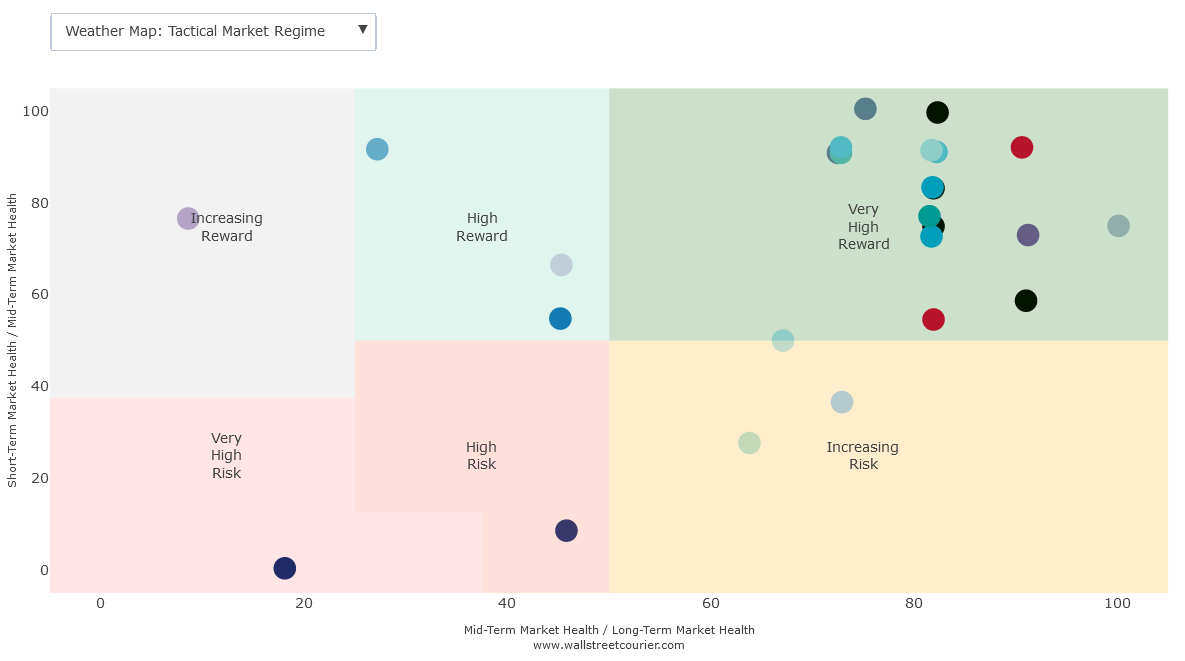
As illustrated in the chart below, global markets are maintaining strength, characterized by a prevalent ‘Very High Reward Market Regime’ across a majority of global equity markets and sectors.

How to spot high-reward & low risk market opportunities

3 Steps for Determining Market Regimes

With our structured approach, we can identify the respective market regime for any market. Our methodology include the following steps:

1

Identify Robust Trends

  • Trends are measured through a systematic screening of signals from multiple indicators (for example the WSC Trend Index, the Smart Money Flow Index or the Daily Put-/Call Ratio All CBOE Options)
  • These indicators cover various categories (trend, trend quality, and sentiment, including dumb- and smart-money positioning) and timeframes.
  • This diversified approach minimizes the impact of noise in individual indicators and enables an unbiased and robust view of current market conditions.
2

Monitor Market Health

  • These indicators are representing composites of these signals for three different timeframes.
  • Scores on a 0 to 100% scale denote signal positivity.
  • Values below 50% indicate a negative outlook, while those above 50% signal positive market health.
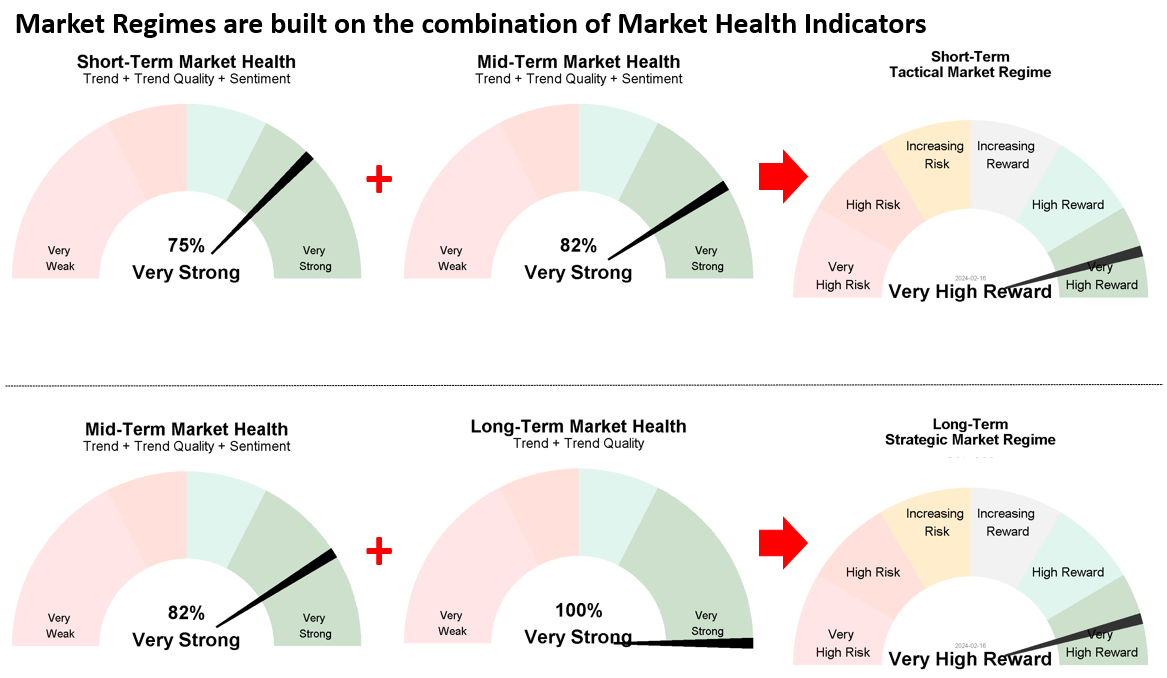
  • The combination of these health indicators results in market regimes, indicating the strength of the current trend for a specific timeframe.

3

Determine Market Regimes

  • By combining short- to mid-term and mid-term to long-term market health readings, the specific market regime is determined.
  • These Market Regime gauges help identify market regimes and shifts without the hassle of going through all indicator signals.
  • To be more precise, the Tactical Short-Term Market Regime is constructed upon the combination of short- to mid-term market health, while the Strategic Long-Term Market Regime is based on the amalgamation of mid- to long-term market health.

From Market Health Indicators To Market Regimes:

By combining short- to mid-term and mid-term to long-term market health readings, the specific market regime is determined. These Market Regime gauges help identify market regimes and shifts without the hassle of going through all indicator signals. To be more precise, the Tactical Short-Term Market Regime is constructed upon the combination of short- to mid-term market health, while the Strategic Long-Term Market Regime is based on the amalgamation of mid- to long-term market health.

What the history tells us about the current Market Regimes

Since the availability of full market regime data dating back to 1998, the MSCI World has entered a ‘Very High Reward Market Regime’ 357 times from a tactical/short-term point of view and 107 times strategically. Remarkably, in 82.4% of these instances, the MSCI yielded a total cumulative gain of 562.2% for short-term traders and 224.75% for strategic investors. The most substantial gain recorded within these occurrences was an impressive 32.2% for tactical investors and 13.9% for strategic ones. Therefore, we find the outlook on the MSCI World compelling, contingent on the underlying markets remaining robust.

Want our Market Regime Trend Analysis sent directly to your mailbox?

Market Regime Newsletter

In our Market Regime Newsletter, we provide analyses of specific markets using our approach to deliver precise outlooks. This showcases our consistent research approach and enables users to efficiently apply our indicators and tools to analyze any market.

Sign up for free to receive our Market Regime Newsletter